
Friday, 26 February 2021

How to Build a Sales Forecast Model

How to Build a Sales Forecast Model

In an ideal world, sales teams and business leaders would have crystal balls to help them predict accurate sales forecasts.

With these predictions, it would be easier to create budgets, set goals, know when you’ll need to hire more people, and so much more.

Unfortunately, crystal balls belong in the movies, and predicting anything in business, especially revenue, can be challenging.

Then what’s the best way to go about creating sales forecasts for your business?

Firstly, you need to understand what forecasting is.

In a nutshell, a sales forecast is your predictions of what you will sell weekly, monthly, quarterly, or annually.

An important element for forecasting is to be more realistic than hopeful. Too often, sales teams will be overly optimistic when setting goals.

This, unfortunately, leads to disappointment when you’re halfway through the year and your team starts realizing that you’re still far from reaching your goals.

I want better for you. I want you to set goals that you can reach. Goals that will help keep you and your team motivated.

Here’s my detailed breakdown of how to predict your business’s future revenue.

Pros and Cons of Doing Your Own Sales Forecasting to Predict Revenue

Some business leaders and sales teams decide to create their own forecasts. Is this a good idea?

Well, let’s have a look at some of the advantages and disadvantages of this.

Pro 1: You’ll Gain Valuable Insight

Since forecasting involves looking into historical and real-time data, you are forced to gain insight into your business’s health and overall growth. This information can help you set better future goals for your business.

Pro 2: You Can Decrease Costs

If you have a small business or startup, you’re likely trying to cut costs any way you can. Doing some essential tasks on your own, like revenue predictions, will help you save costs that you can channel into other areas of your business.

Pro 3: You’ll Know What to Focus On

There are many moving parts to a growing business. Understanding each component helps you achieve your overall business goals.

When you do your own sales forecasts, you’ll know what you need to focus more on to help your business continue growing.

For instance, if you predict that your sales will increase by 5 percent in the next three months, you can then allocate the necessary resources to help your sales team achieve this goal.

Con 1: Sales Forecasting Takes Time

As highlighted above, you’ll need to create revenue predictions that may be weekly, monthly, quarterly, or annually.

To create these forecasts and make an informed decision, you’ll have to look into historical data. This can be time-consuming to do on your own.

Con 2: Lack of Input From Outside the Company

Sometimes, it’s challenging to see the whole picture when you’re in the frame. Employing a team of planners from outside the organization can help you get someone else’s informed decision on your company. This can give you valuable insight into the health of your company.

If you’re the business owner, it’s challenging to be subjective and remove all emotions when creating forecasts. Your business means a lot to you.

You’re working hard to ensure that it’s a success. If you’re not careful, your projections have the potential of being more optimistic than realistic. An outsider will be more objective and base each decision on real data.

If you’ve weighed up your pros and cons and feel that you would like to create your own forecasts, it’s now time to understand how these can benefit you.

Why Use Sales Forecasts?

Before we get to how we first need to understand why we need sales forecasts in the first place. What value do they add to your business?

When you build a solid sales forecast, you can foresee potential issues and work on fixing them.

For instance, if you’re halfway through the year and see that your sales are trending 20 percent below quota, you can quickly assess the situation to figure out what is preventing you from achieving your goals.

Figuring out potential problems right away, instead of waiting until the end of the year or the quarter, can make a huge difference in any business.

Having you and your sales team be aware of the sales forecast can work as a great motivation tool. You can have weekly or monthly sales updates to let the team know how far you are from reaching your goals.

An important thing to remember when building sales forecasts is that they won’t be perfect. By the end of the quarter or financial year, you might be below your goals, or you might have surpassed them.

Whatever the case may be, creating forecasts is still a necessary part of your business plan as they help you and your team stay on the same page and work toward common goals.

Instructions for Creating a Sales Forecast to Predict Revenue

Now that you understand the value of building a solid sales forecast, let’s get into how to get it done.

1. Pick or Create a Sales Forecast Template

What specific information do you want to get out of your sales forecast? This is an important question as the answer will help you decide on the template that makes the most sense for you and your business.

You may want to look at information like:

  • How much revenue you currently earn in a quarter, and how much you predict to make in the next quarter.
  • Are you introducing a new product? How much revenue should you expect to generate from the product, considering past and current market trends?

You may be able to find a template for what you’re looking for, or you can create a unique template that includes all the metrics you’re interested in tracking and makes the most sense for your business.

2. Select the Products Included in Your Sales Forecast

The products you include in your sales forecast will depend on what you’re specifically forecasting. For instance, if you decide to create a quarterly sales forecast, you may include all your sales for that period.

On the other hand, if you want to forecast sales for specific verticals or products, you’ll probably only have those products.

It’s essential to be as specific as possible and also be clear on how you would like to incorporate the products you’ve selected for consideration in your forecast.

For instance, if you’ll be forecasting sales across a quarter, you need to decide how to set your actual forecast.

You can include a line prediction for each product you sell, and you can include another line item for how much you expect to sell in your different product lines or categories.

If you would like to create a medium- to long-term forecast (e.g., over a 12-month period), you can develop monthly forecasts leading up to that period.

These forecasts can include the price per unit and units sold for each product.
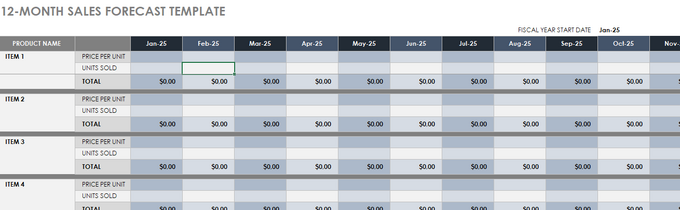
Instructions for Creating Sales Forecast - Select the Products Included in Your Sales Forecast

3. Calculate Predicted Revenue

Now’s the fun part: calculating your predicted revenue. There are multiple ways you can predict future revenue.

You Can Use Historical Data

If you’ve been selling your products or services for a while, looking into your historical data to give you an idea of a realistic revenue you can expect to achieve is essential.

While considering historical data can help, it’s not always an accurate predictor of future sales. For instance, you might have been a newcomer in the past, but now you may be well-established in your industry.

The sales you received in your first year won’t match the sales you’ll receive in this coming year.

While this is true, it’s always important to consider historical data as this is your foundation. You can use this information as a baseline for your sales goals.

You Can Consider the Season

Some products are seasonal, while others sell at a consistent rate all year long. There are also certain times of the year (e.g., Black Friday, Cyber Monday, and Christmas season) where consumers generally spend a lot of money. These factors will affect your revenue during these periods.

You Can Consider the Market

No matter how amazing your product or service is, sometimes there’s a ceiling regarding how much you can realistically sell at certain times. For instance, if you sell gadgets, what used to be “cool” five years ago may not be today.

The tech space is constantly evolving, and if your products or services don’t get updated to meet consumer demands, your revenue might tend toward a downward trend.

After considering all these factors, you can look at the best-case scenario and then predict sales based on that number.

Again, it’s essential to be realistic here. If you own a pizza place and your only competitor from across the street sells an average of 50 pizzas per day, predicting to sell 1,000 pizzas per day is more hopeful than realistic.

Many professionals use scenario analysis to help them understand what the best- and worst-case scenarios may be for their predicted revenue.

4. Create a Tracking System

Creating a tracking system is one of the most crucial elements to successfully forecasting.

If, for instance, you find that you’ve made predictions that are way off when you’re in the middle of the sales cycle, referring to your tracking system will help you immediately see this. You can then quickly update or adjust your sales forecast.

The tracking system you use doesn’t need to be complicated. For example, you can create an Excel spreadsheet and even create graphs, like this one from SmartSheet, to help you see whether your sales are reaching, below, or surpassing your predicted revenue.
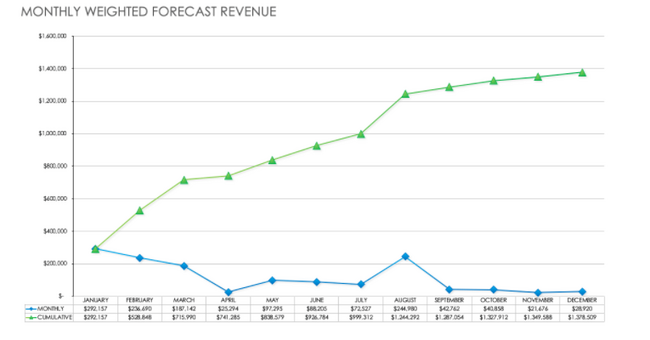
Instructions for Creating Sales Forecast to Predict Revenue - Create a Tracking System

5. Ensure Your Team Is Aligned

The value of having a team that’s working toward the same goals can’t be overstated. That’s why it’s essential to ensure that every team member is aware of the sales forecasts and, more importantly, that they agree with them.

Why?

While you may be the leader, you can’t achieve your predicted sales on your own. You need everyone to work toward reaching those goals and also believe in them.

Sharing with your team can also help you get their valuable opinions on the predictions you made.

Maybe you missed an important factor that might affect sales for that period. Or maybe there’s a new trend in the market that your sales team recently discovered. Their input is essential before the stakeholders sign off on the sales forecasts.

6. Use Tools to Make Your Sales Forecast Process Easier

We’re well into the digital age, and there are various tools that can help make your life a little easier.

For instance, you can use Google Sheets to create your forecasts in a neat spreadsheet. Furthermore, you will be able to access them from any device with internet access.

To keep in touch with your team and share regular updates on forecasts, you can use online collaboration tools, such as Asana, Trello, or Slack.
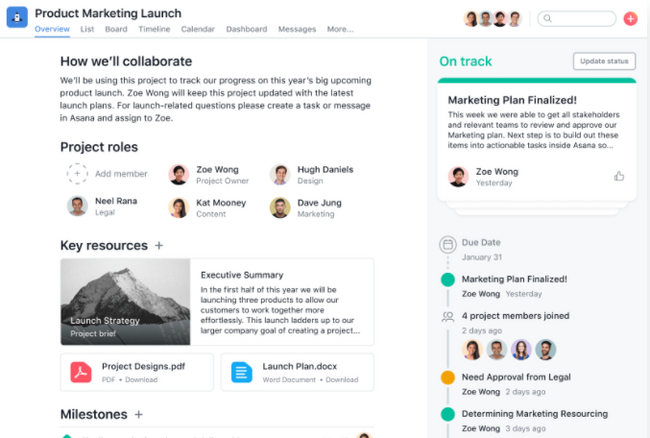
Instructions for Creating Sales Forecast to Predict Revenue - Use Tools to Make Your Sales Forecast Process Easier

All these tools allow you to share links and documents with your team members so that they can access valuable information at any time.

When choosing tools, look for options that are easy for you and your team to use and integrate. It’s also important to pay close attention to the privacy policies of the organizations. In addition, consider tools with multiple features to make organization a little easier.

Conclusion

Sales forecasting is an essential part of your business, but sometimes generic templates aren’t relevant. Use the above tips to create an informed sales forecast that will work for your needs.

Have you created a sales forecast model before? What interesting tips can you share?

The post How to Build a Sales Forecast Model appeared first on Neil Patel.


from Blog – Neil Patel https://ift.tt/3koyDyB
via IFTTT

Social media management is a full-time job, but this tool can help

Social media management is a full-time job, but this tool can help

TL;DR: Get on top of your social media game with the HelloWoofy Social Media Management tool, on sale for 91% off. As of Feb. 26, get a one year subscription for only $49.


A lot goes into running a successful social media account. You have to post at the right time of day, write engaging captions, keep track of analytics, and monitor what's working — and what's not. Pre-scheduling a couple posts and logging off for the weekend just doesn’t cut it.

More than just a scheduling tool, HelloWoofy uses AI technology to help you improve your business's social media presence. Good for entrepreneurs and small businesses alike, the platform can create social media posts or blog content, recommend hashtags, suggest engaging emojis, and schedule single posts or entire campaigns.  Read more...

More about Social Media, Apps And Software, Mashable Shopping, Tech, and Work Life


from Social Media https://ift.tt/3pQWBn6
via IFTTT

Twitter's 'Super Follow' will finally let you charge for your precious tweets

Twitter's 'Super Follow' will finally let you charge for your precious tweets

Your #content will definitely be worth every penny.

During a Thursday investor call, Twitter announced a plan to let users charge followers for access to "exclusive content." Dubbed "Super Follow," the service will bring an element of Patreon-like monetary support to a social-media ecosystem that up until now has largely been fueled by the social capital of likes and retweets. 

While the final details may change, the example shown during Thursday's call included a $4.99-per-month subscription plan that comes with "subscriber-only newsletters," a "supporter badge," "community access," and other perceived perks.  Read more...

More about Twitter, Social Media, Tech, and Social Media Companies


from Social Media https://ift.tt/2ZTOHyA
via IFTTT

An ode to pandemic pen pals

An ode to pandemic pen pals

Until about a year ago, I had never bought stamps.

I knew how to send mail, thanks to an elementary school lesson tucked away in the recesses of my memory, but I could probably count the number of times I had actually written a letter on one hand. Since last year, writing letters has become one of the few ways to make new friends that doesn't feel like exhausting or risk contracting and spreading COVID.  

When the pandemic first moved all socializing online, I embraced it; Zoom happy hours were still a novelty and gathering friends for virtual birthday parties felt like a noble effort to curb the spread of the coronavirus. The longer the pandemic continues, though, the more tiring it is to maintain a social life entirely though online interactions. It's especially discouraging to keep up when so many others gave up on social distancing months ago.  Read more...

More about Social Media, Pandemic, Culture, and Web Culture


from Social Media https://ift.tt/2MnslCy
via IFTTT

What is Rumble, Donald Trump Jr.’s new favorite online video platform?

What is Rumble, Donald Trump Jr.’s new favorite online video platform?

While former president Donald Trump may no longer be posting after being banned from most major social media sites, his oldest son is testing the waters at one of the newest video conservative-friendly video platforms: Rumble.

Last week, Donald Trump Jr. began posting daily videos to Rumble. It’s not just video uploads either. Don Jr. has also been promoting Rumble on other platforms too. Over the past week, he has repeatedly used his Twitter account to boast about the "level playing field" Rumble provides for conservative content.

Over the weekend, the eldest Trump child even posted a video explaining why he would be using Rumble for his video content from now on. Read more...

More about Social Media, Conservative, Donald Trump Jr., Tech, and Politics


from Social Media https://ift.tt/3aQBoFD
via IFTTT

The most important Instagram statistics you need to know for 2021

Looking for Instagram statistics to guide your strategy in 2021?

Good!

Because the platform is perhaps the most rapidly-evolving across all of social media. And trust us: plenty changed in 2020 that’ll ultimately influence how you approach the ‘gram moving forward.

Below we’ve broken down an up-to-date list of Instagram stats to help you make the most of the network in 2021.

Instagram user and usage statistics

Let’s start with a basic question: how many people use Instagram?

Fun fact: Instagram surpassed the 1 billion global user mark as 2020 came to a close. A massive milestone that was seemingly only reserved for the likes of Facebook, this stat is a testament to Instagram’s staying power. In fact, Instagram’s user growth has been consistent and doesn’t show any signs of slowing down.

Graph from Emarketer forecasting worldwide Instagram usage statistics from 2019-2023

So, how many downloads does Instagram have versus other social apps? According to data from Sensor Tower, Instagram was among the top five most-downloaded apps in both the App Store and via Google Play last year. The app scored ~13 million downloads in Q2 2020 alone. As of January 2021, the app is second only to TikTok in the App Store in terms of downloads (occasionally sparring with Facebook).

Bar graph showing the most-downloaded apps in the U.S. in Q2 2020


Now, let’s take at some Instagram statistics that shed some light on who’s using the platform. Recent social media demographics continue to point to a predominantly female (34.3%) user base that’s under the age of 34.

Although there are still older users present, the platform is largely still dominated by Gen Z and Millennials. This is further driven home by some recent Instagram stats compiled by Statista.

Statista bar chart showing Instagram demographics by age and gender as of October 2020

Beyond appealing to the younger crowd, Instagram is known for its rabid user base. Case in point, 63% of Americans say they check Instagram daily. Couple this data with research conducted in Australia which notes the average Instagram user spends at least 7 hours per week on the platform.

Key takeaways

  • Instagram’s user growth has been steady and consistent, especially among the younger crowd.
  • Building on the point above, Instagram’s users are among the most dedicated in terms of how frequently they log in.
  • The sheer number of app downloads signals the importance of mobile optimization for your Instagram marketing strategy.

Instagram content statistics

The Instagram algorithm has tripped up marketers in the past and that trend looks to continue in 2021.

Recent Instagram statistics tell us that organic engagement has fallen from 2020, which was at 1.60%. For reference, research from RivalIQ puts the average engagement rate at 1.22%. Long story short? Organic engagement isn’t what it used to be.

Bar chart from Rival IQ showing Instagram engagement rate across all industries

So, which types of content should brands prioritize to fight the phenomenon of lower reach? Research from Bannersnack highlights that Carousel posts score the highest engagement rate (1.94%) followed by images (1.74%) and video posts (1.45%).


Average engagement rates per carousel, image and video post on Instagram

This might come as a bit of surprise given that Carousels aren’t talked about as much compared to, say, Reels or Stories.

That said, video content is still booming. Interest in binge-watching content grew significantly in the midst of the COVID-19 pandemic with 70% of marketers looking to up their investment in video. This comes hot on the heels of Instagram Reels and looming competition from TikTok.

Speaking of which, TikTok (29%) just barely edges out Instagram (25%) as teens’ preferred social platform of choice. In terms of content, expect Instagram to continue to push Reels. With Reels ads seemingly on the horizon, brands should consider double-dipping their short-form video across both Instagram and TikTok rather than choosing between them.

Graph showing Gen Z/U.S. Teen's favorite social platform, Instagram being 25%

But the big story when it comes to our Instagram stats surrounding content is, well, Stories.

According to Instagram themselves, 500+ million people use Stories daily and one-third of the most-viewed stories come from brands. Stories should remain a staple of your content strategy, especially as they allow brands to “skip the line” in followers’ feeds and aren’t restricted by the Instagram algorithm.

Wrapping our Instagram content statistics, we’ve found that the best time to post is Wednesday at 11 a.m. and Friday from 10–11 a.m. Posting at the times when your audience is most likely engaged should be common practice. Scheduling tools like Sprout Social can help with that.

Heat map showing the best times to post on Instagram

Key takeaways

  • Stories, Carousels and short-form video should remain central to your content strategy.
  • With fierce competition and so much content floating around, even the smallest aspects of optimization (think: timing, captions, bio) count.
  • As engagement rates dip, brands should consider supplementing their content with Instagram ads.

Instagram advertising statistics

Piggybacking on the Instagram stats above, social ads are becoming more and more popular.

According to research by Smartly.io, a staggering 50% of marketing teams spend half of their marketing budgets on social ads. Specifically, 29% of marketers spend the majority of their ad dollars on Instagram.

Graph showing on which platform the most ad spending occurs; Instagram is 29%


Data from Merkle highlights how Instagram Stories ads have been performing especially well for brands lately. Their research noted that Stories ads generated 35% of impressions and 29% of total Instagram ad spend for brands in Q3 2020. Also notable is the fact that Stories ads boast a lower-than-average CPM despite their recent growth.

Another fascinating Instagram statistic from the Merkle report highlights how many companies are running side-by-side ads on Facebook and Instagram In fact, Instagram accounted for 33% of Facebook ad spend and 36% of impressions for brands rolling out campaigns on both platforms.

Bar chart showing Instagram and Facebook ad share by spend and impression

Meanwhile, a recent Socialbakers report highlights how much cost per click (CPC) has dropped for Instagram Feed (~20% YoY) and Stories ads (~15% YoY).

Bar graph showing the cost per click by platform position with Instagram feed and Stories in the lead and growing year over year

We can’t talk about Instagram statistics without talking about influencers, though.

While there’s been some skepticism about whether or not influencers would stand the test of time, the numbers don’t lie. According to Instagram, 87% of people say that an influencer has driven them to make a purchase. They also note that 70% of “shopping enthusiasts” turn to Instagram for product discovery.

Even if people aren’t buying from influencers directly, there’s no denying their impact on cementing Instagram a shopping hub. For those that do purchase from influencers, standard image posts (78%) and Stories (73%) are regarded as the most effective types of influencer content according to MediaKix.

Key takeaways

  • Although not quite at the level of Facebook’s popularity, Instagram’s ad platform is definitely growing.
  • With new ad types rolling out every year, brands have more freedom than ever when it comes to their campaigns (signaling both challenges and opportunities).
  • Influencers still have staying power despite rumblings from critics both prior to and during the pandemic.

Instagram statistics for brands

To wrap things up, let’s look at some general Instagram stats for brands to keep in mind for 2021.

An oft-cited stat that has ticked upward year-over-year, 90% of people now follow a business on Instagram. Look no further than the consistent roll-out of new business features and shopping options for ecommerce merchants as evidence of how the platform is becoming more brand-friendly.

Perhaps this explains why Instagram is now the popular platform for following brands. This showcases not only the opportunities to sell products on Instagram, but also provide customer service and support.

Bar chart showing the use of social media to follow brands, with Instagram leading all other social platforms at 36%

However, remember that Instagram isn’t just a B2C network anymore as 46% of B2B content marketers used organic Instagram within the past 12 months. Not quite as much as LinkedIn (95%) or Twitter (86%), it’s still telling that Instagram is growing in popularity for B2B. For example, business influencers and SaaS marketers are slowly but surely staking their claim on the platform.

Pie charts showing how B2B content marketers used in the last 12 months

Key takeaways

  • Organic Instagram is valuable for both B2C and B2B brands for the sake of building brand awareness.
  • More people are following brands on Instagram than ever before, signaling how the platform could rival Facebook in terms of shopping and ads in the long-term.
  • Even if Instagram isn’t resulting in direct sales, the network remains a key component of any social marketing funnel for educating and nurturing customers.

Which Instagram statistics stand out to you?

Listen: Instagram is a fast-growing and ever-evolving network.

Making the most of the platform means knowing how to adapt. Hopefully, the Instagram stats above can help you master the platform this year.

And if you’re still in need of advice or inspiration on how to make the most of 2021, make sure to check out our most recent guide on how to build your social media marketing strategy.

This post The most important Instagram statistics you need to know for 2021 originally appeared on Sprout Social.


from Sprout Social https://ift.tt/2vlaZeZ
via IFTTT