Google Analytics (GA) is one of the most powerful tools on the web for website analysis. When properly set up and used, it allows you to break down your website traffic and gather vital information to power your digital marketing strategy.
While GA has been around for some time, many people still don’t use it to its maximum potential. They only scratch the surface.
In this post, I’ll show you how to graduate from the minor league of GA users to the pro level. This will give you an edge over your competitors as you’ll be able to dig deep into crucial data novices overlook. As a result, you’ll be able to create more effective campaigns and content.
How do you use Google Analytics like a pro?
Make Sure You Have the Basics Down
Before you can pull cool pro moves in Google Analytics, it’s essential to get the basics right. Here are the important steps to tackle first:
Make Sure Google Is Crawling Your Site
To get the most out of Google Analytics, Google must already be crawling your site. It might seem basic, but overlooking this will tank everything else.
Go to Google Search Console (GSC) and click the site you want to crawl to enable crawling. In the “Crawl” section, click on “Fetch as Google” then:
- Enter the path to the page you want to crawl in the text box.
- Select both the desktop and mobile versions of your website for testing.
- Once testing is done, request indexing.
- Request Google to also index all direct links.
Understand What Content Is Most (and Least) Popular
Content is the foundation of all your campaigns and marketing. That’s why it’s essential you must understand what content is most (and least) popular on your website.
To do this you need to pull the report by logging in to your GA account and going to Behavior> Site Content> All Pages. Once there, sort your pages according to the criteria relevant to your needs. For example, you could sort them according to page views, average time on page, etc.
Analyzing your content this way helps you understand why top-ranking content is doing well so you can repeat that strategy elsewhere.
Understand the Different Types of Google Analytics Reports
One of the best things about Google Analytics is that it gives you a holistic view of your website activity. This is through the five main reports, including:
- Real-time: The activity on your site in real-time.
- Audience: Inside scoop on your website visitors
- Acquisition: Details on how visitors found your website
- Behavior: What people are doing on your site
- Conversions: How behavior leads to conversions and sales
We’ll go into greater detail into some of these reports later in this post. So, let’s get to using GA like a pro, shall we?
Step 1: Set Up Google Analytics Goals
A goal is an activity you want people to take on your website. Examples of goals include:
- filling in a contact form
- making a purchase
- downloading an e-book
- any other activity relevant and crucial to your business’s success
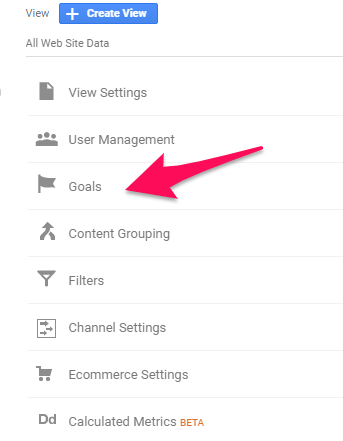
To set GA goals, head over to the admin tab of your GA account and select “Goals:”

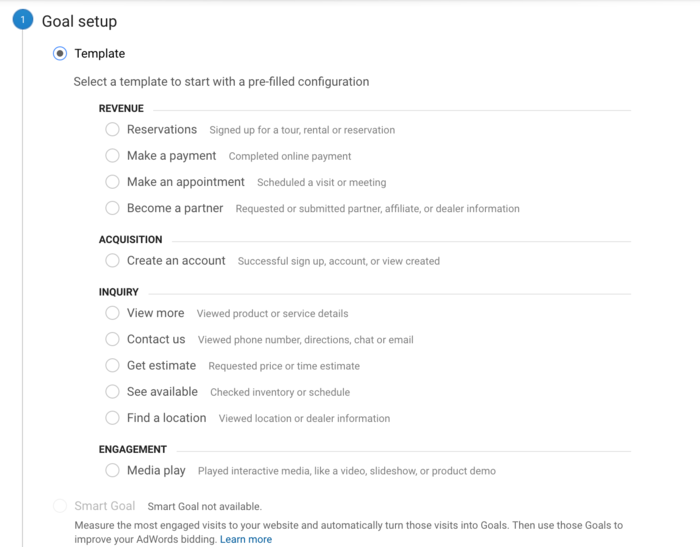
Next, click on “New Goal” and select one of the templates provided. Alternatively, scroll to the bottom and select the “Custom” option.

There are four main types of goals you should set and track in Google Analytics. These are:
- Destination goals: Set these to track visits to pages crucial to helping you achieve business goals.
- Visit duration goals: Track how long people spend on particular pages on your site, related to the total duration of a user session.
- Pages visited per session goals: This goal tracks the number of pages each visitor sees in a single session.
- Event goals: As the name suggests, these are triggered when a user completes a specific event on your site, such as signing up for an email newsletter or hitting a specific landing page you set.
Defining goals is a fundamental component of measuring your website analytics. That’s why you should set and properly configure your goals in GA. This makes it easier to track them and understand how well online marketing campaigns work. You’ll be able to evaluate if they’re effective, and if not, use the data to create better iterations.
Step 2: Understand Google Analytics’ Real-Time Reports
The Real-Time reporting section of Google Analytics allows you to monitor your website activity as it occurs. This shows you how people are reacting to your marketing campaigns and infrastructure.
Real-Time reports are excellent for tracking time-sensitive promotional campaigns. They’re also excellent for troubleshooting UTM parameters and events among a whole host of uses. For example, you can see your audience’s reaction to a new blog post or an email marketing campaign.
What kind of data can you get from Real-Time reports in GA? Let’s take a look.

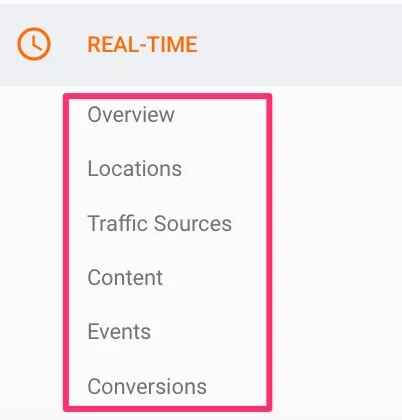
Here are the six attributes you can measure:
- Overview: This report shows the big picture of what’s happening on your website, including location, traffic sources, and the number of visitors to pages being visited, and much more. All in real-time.
- Location: View the geographic location a user is in, both in list form and on an interactive map.
- Traffic sources: Zero in on the websites your current visitors are coming from. The data is conveniently organized by Source (origin of traffic) and Medium (category of source). It also shows the number of visitors from each one.
- Content: The Content report shows which pages your current visitors are spending time on. You can switch your view between current active users and a list of page views in the past 30 minutes.
- Events: Track your event goals in real-time and drill down on specific event categories and actions.
- Conversions: This report shows which goals active users are completing. It also gives insights into the total number and percentage of active users who have completed a goal.
To see your Real-Time reports, sign in to your Google Analytics account, navigate to your website and select the desired view. From there, click on “Open Reports,” then “Real-Time.”
Step 3: Take a Look at Acquisition Reports
Acquisition reports in Google Analytics help you understand where your traffic is coming from. They also help you understand how your marketing campaigns are performing.
Some of the data you get from the Acquisition Overview Report includes:
- What channels drive the most traffic to your website (direct, organic, paid, social, email, other websites, etc.)
- Engagement metrics for each channel (for example, bounce rate, session duration, pages per session, average session duration.)
- Conversions and conversion rates per channel
You can also track traffic sources on a more granular level. You can do this by customizing your acquisition report tables to show particular events or conversions you want to track back to a source.
What can you use this data for?
Knowing where your website visitors come from is a critical element of running and managing digital marketing campaigns. That’s what Acquisition Reports help you do.
Digging deep into your traffic acquisition reports will help you know which channels are driving traffic to your website. As a result, you’ll know where to focus more of your time and resources to build more effective campaigns.
Understanding your traffic sources is also essential to helping you create hyper-personalized content and campaigns for your target audience. As you well know, personalization is critical to standing out in a noisy digital world.
Step 4: Enable Google Analytics Demographics and Interests Report
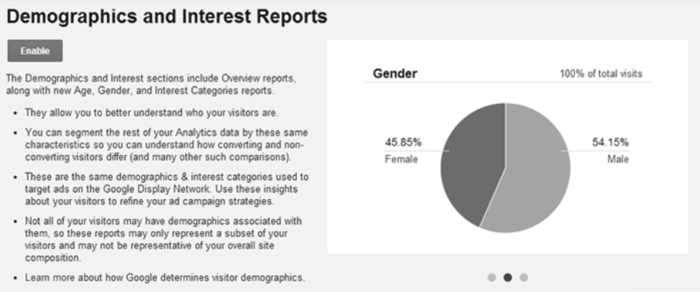
One of the best features of Google Analytics is the Demographics and Interests Report. This allows you to get a clear picture of your web visitors. For example, it provides data on your audience’s gender, location, and interests, among other essential audience-centric data.

To get this essential data, you must enable the Demographics and Interests report.
Note that if you have activated Google Signals, you can’t enable the Demographics and Interests reports.
How do you enable the Demographics and Interests report?
- Log in to your Google Analytics dashboard.
- Select the website where you want to enable Demographics and Interests
- Click on “Audience.”
- Select “Demographics” then “Overview.”
- Click on “Enable.”
Once you’ve enabled the report function, it may take a day or two for Google Analytics to generate your audience’s demographic data.
To better analyze the user behavior of defined segments, you can create an advanced segment in Google Analytics.
The Interests report is especially important as it shows other topics your audience is interested in. This report can be broken down into three categories:
- Affinity categories: This category shows the general interests of visitors to your site, such as hobbies and activities they enjoy. This data is essential when creating brand awareness campaigns tailored for your target audience.
- In-market segments: These are users who show high purchase intent. You can use this to reach those who are in the consideration phase.
- Other categories: This groups users by general Acquisition, Behavior, and Conversions metrics.
Identifying the demographics and interests of your visitors will help you target high-value users. Again, this will help you fine-tune your campaigns to ensure better results.
Step 5: Use Google Tag Manager to Better Understand the Impact of Your Marketing
Google Tag Manager (GTM) is a handy Google Analytics feature that allows you to deploy and manage marketing tags (snippets of code or tracking pixels) without you having to modify the code. With GTM, you don’t have to rely on a developer to create, test, deploy, and fix your tags.
So how does GTM help you better understand the impact of your marketing?
Two words—event tracking.
With traditional marketing, you needed developers to create different rules for tracking different events. This was a lot of work and required a lot of time. GTM, however, allows you to easily specify the events you want to track.
All you have to do is input a set of attributes you want to look for and record on your web pages. Of course, this makes it way easier to quickly monitor and measure the success of your campaigns.
Another advantage of GTM is that, unlike traditional analytics tools that pull in all types of data (requiring you to sift through it to get the data you want), GTM saves you time by allowing you to specify the data you want.
You can also specify the triggers that fire off those tags, ensuring that the data collected is what you need to measure the performance of your campaigns.
While GTM is an awesome tool that makes managing tags easy, it still requires a learning curve if you don’t have technical experience. This post will walk you through how to get the most out of Google Tag Manager.
Step 6: Learn How to Build Custom Reports
Google Analytics comes with pre-configured reports containing valuable data. However, to get the most out of GA and access data that is more relevant to your business goals, you may need to create custom reports.

Custom reports you can create include:
- Site performance and acquisition patterns (like browser reports, customer behavior reports, etc.).
- Content performance reports (content efficiency report, referring sites report).
- SEO reports (keywords analysis report, referring pages report).
How do you create custom reports?
Create Your Custom Report
To create your custom report:
- Log in to your GA account.
- Open the “Reports” tab.
- Click Customization > Custom Reports.
- Add a New Custom Report and name it.
Choose a Report Type
Once you’ve completed the steps above, you’ll choose a report type. Your options here are:
- Explorer: This is the standard GA report type.
- Flat table: Presents your website’s data as a sortable, static table with rows and columns.
- Map overlay: Uses a map format to depict engagement and traffic volume.
- Funnel: Displays a graph of the number of users who completed, and who did not complete, each stage of a funnel. You get to see which of the stages perform well and which don’t.
Configure Metrics for Your Custom Report
The metrics you’ll use in your custom report are influenced by the selected report type. This also determines the data included in your custom report. To add the specifics metrics you want to track:
- Click +add metric.
- Search through the options provided or, type in the metric name you want to include.
- Click on the metric(s) you want to see.
Consider Adding Filters (Optional)
Filters enable you to restrict the data shown in your custom report. This is an optional step. To add your filter(s), click on “+add filter” and select the ones you want to apply.
Use Google Analytics Like a Pro Frequently Asked Questions
Is Google Analytics really free?
Yes, it is totally free to use and gather data. To get started, follow this guide to add the site tag to your website and start gathering data.
Is Google Analytics certification worth it?
Google Analytics can be overwhelming. However, if you can grasp some of its advanced features and uses, you’ll be able to create highly targeted and effective campaigns. So yes. Google Analytics certification can be worth it if you do a lot of work with GA.
What is the Demographics and Interests reports and what does it do?
This essential feature gives you insights into the demographics of your target audience. As a result, you can create personalized campaigns. Most notably, it must be enabled to gather data.
How do I use Google Analytics for SEO?
You can set SEO goals in GA and create a custom report that will help you collect relevant data about those goals. Alternatively, use GA to note traffic sources that drive the most traffic and create content and campaigns tailored for those sources.
Using Google Analytics Like A Pro: Conclusion
Google Analytics is a powerful tool every marketer should have in their tool stack. It’s a great source of data that shows you what’s happening under the hood of your website and marketing campaigns.
It also provides actionable insights for building better landing pages, A/B test content, and track where your traffic comes from.
However, with the competition for customers getting stiffer each day, you need to go beyond the basics of GA. You should learn how to use it like a pro.
What other Google Analytics features and functions do you find useful?
from Blog – Neil Patel https://ift.tt/386OIDE
via IFTTT
No comments:
Post a Comment