
Wouldn’t it be nice if you could see your website through Google’s eyes?
We all know the fine details of Google’s algorithm are a closely kept secret. At the same time, we have a lot of information about the aspects Google deems important when judging a website.
What’s more, Google offers us a host of free tools designed to help us improve our websites—and one such tool is Google Lighthouse.
One ranking factor we know is becoming more and more critical is page experience, and Google Lighthouse could be the tool you need to make sure your website is performing in this area and many more.
What is Google Lighthouse?
Google Lighthouse is a free tool that provides powerful insights to help improve your website. By generating a Lighthouse report, you can assess any web page’s page experience and access valuable tips to improve its performance.
Google has recently increased emphasis on-page experience, including adding a new set of Core Web Vital signals. The signals break down how a user experiences your page, and you can see how your website performs in this area through Lighthouse.
Since Lighthouse is a Google application, it could be a great way to see your website in the way that Google might see it, knowing any recommendations come straight from the search engine giant itself.
A great thing about Lighthouse is it gives you actionable insights while being simple to use. In just a few clicks, you can get detailed page experience information, providing powerful insights into improving performance.
With more than 3.5 billion searches a day, Google is by far the most popular search engine. So, being able to see how it views and measures your website is extremely useful.
What Metrics Does Google Lighthouse Measure?
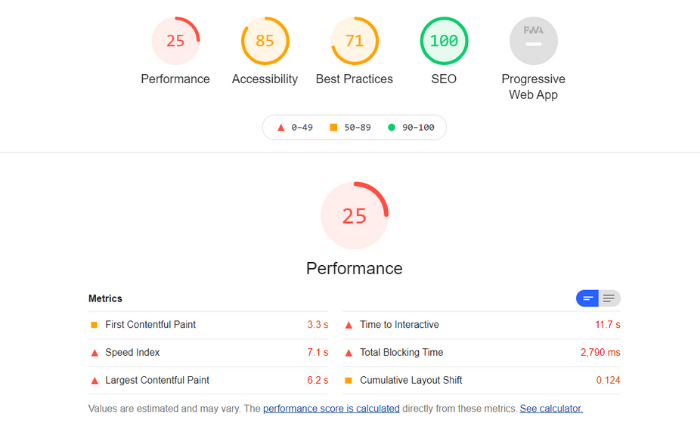
Each Lighthouse report has five categories: performance, accessibility, best practices, SEO, and progressive web app. Google has confirmed that aspects such as load speed and mobile experience factor into its algorithm, so these metrics may give you the ability to see how you’re performing in these crucial areas.
With a clear 1-100 grading system, Lighthouse allows you to audit your pages and find areas for improvement. You can expand each section to get in-depth insights and find places where you can quickly improve your page, as shown in the screenshot below.
Once you’ve implemented the changes, you can then check back with Lighthouse to determine if they have improved your score.
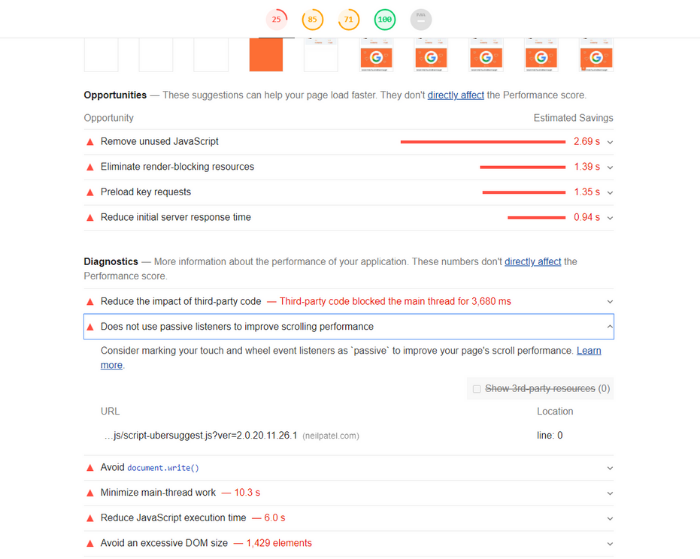
For example, if you expand on “performance,” you can find data directly linked to core web vitals such as time to interactive and first contentful paint.
These metrics give you an idea of how fast your page loads and how quickly it is perceived to load. In other words, it’s not just about how quickly the entire page loads; it’s about the time it takes until the user can interact properly with it.
This information is hugely important because perceived loading speeds make a big difference in how people interact with your website:
- 46% of people say waiting for pages to load is the worst part of their mobile browsing experience.
- The average mobile landing page takes 15.3 seconds to load.
- On average, people spend 70% longer on pages that load in five seconds.
- For every 100 milliseconds your site takes to load, your conversion rate can drop by 7%.
These metrics are a huge part of user experience, and Lighthouse uses core web vitals to give you an understanding of your web page’s quality and performance. When you have this information and even helpful tips on improving performance, you’ve likely got a lot of what you need to make technical improvements to your site.
How Does Google Lighthouse Work?
You may think you can get a good feel for how quickly your pages load by typing your URL into the search bar and seeing if it loads well or not.
However, different people browse the internet in very different ways, and the way someone searches for your site on the other side of the world might be very different from the way you do.
Google knows the majority of traffic comes from mobile devices, and it also knows that the majority of people don’t have access to super fast 4G or 5G. To simulate this, Google tests your web page by visiting your site through a suboptimal 3G connection on a slow device.
Why does Google do this?
Well, pretty much any website can load quickly on a 5G connection, but that’s of no benefit to the majority of people who don’t have such speedy access. Google wants to send all its users to the very best page to answer their search queries, so it aims to rank websites with the best experience.
If your site works well with a poor 3G connection, it will work well with the latest 5G connection. So, Google learns more about your site by testing it with the 3G connection.
If this is how Google is judging your website, then it’s how you should be judging your website too—and this is why Google Lighthouse can be so helpful.
The Role of Core Web Vitals in Google Lighthouse
As I mentioned, Google placed a lot of emphasis on page experience, and it makes complete sense: How users experience your web page is crucial. Google’s recent announcements about core web vitals are the next step in this evolution, and it’s likely to become a ranking factor in 2021.
Core web vitals are some of the first insights appearing on your Lighthouse report; it’s clear these signals are important to Google. Therefore, they have a prominent place in the performance part of your report.
Core web vitals have three key metrics, and though the language might be a little complicated, they are elements you can appreciate when you’re an end-user:
Loading – Largest Contentful Paint (LCP)
As a user, you don’t necessarily need the entire page to load quickly; you just need the most important content to do so. If a website is slow to load the most meaningful content (“largest contentful paint”), it will frustrate users and may cause them to bounce from the page.
Most of the time, we put the critical, eye-catching information above the fold—this is the content that needs to load most quickly.
Interactivity – First Input Delay (FID)
“First input delay” is an important metric because it measures a user experience error that annoys everyone who’s ever used the internet.
You know when you click the submit button on a form, and nothing seems to happen, so you end up aggressively clicking it over and over?
First input delay measures the time between the user initiating an action (like clicking “submit”) and the website moving on that action (sending them to the next page). A long first input delay can be frustrating for users, resulting in leaving your page and looking for information elsewhere.
Visual Stability – Cumulative Layout Shift (CLS)
You may often notice another UX error when you browse on a mobile device: Cumulative layout shift.
“Cumulative layout shift” is when content moves around on the screen as the site loads. This might not seem like a big issue at first glance, but the problem comes when you go to click something and, suddenly, it’s moved. It’s obnoxious to the end-user, so it’s an important metric to pay attention to.
The Differences Between PageSpeed Insights and Google Insights
You might be thinking, “this all sounds great, but how does Lighthouse differ from PageSpeed Insights?”
If you type a URL into PageSpeed Insights, you’ll see insights that look very similar to Google Lighthouse. But, there are a few important differences.
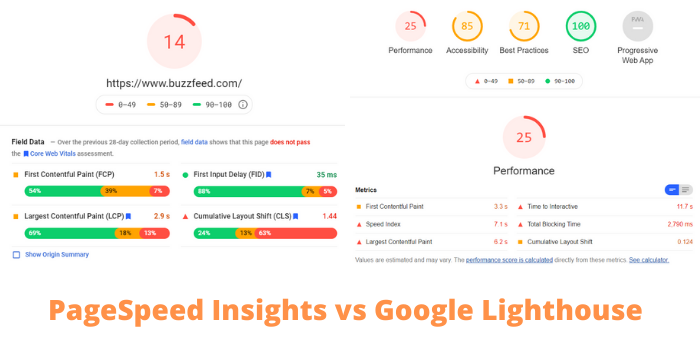
The main difference is that PageSpeed Insights only focuses on page performance. Google Lighthouse offers a complete picture of your page experience by analyzing accessibility, best practices, SEO, and progressive web apps.
“So what’s the point of PageSpeed Insights if Google Lighthouse offers a more complete analysis of my site?” I hear you ask.
PageSpeed Insights draws on real-world data to judge your website’s performance as well as lab analysis. Lighthouse only uses lab analysis in its report, so while results are based on a comprehensive scan of your site, it’s not necessarily the real-world experience your users get.
“So what you’re saying is PageSpeed Insights is better for judging performance?”
If you’re looking purely at performance, PageSpeed Insights offers all the information Lighthouse does—but with the bonus of real-world data collected from interactions with your website. However, your website’s success is based on the entire site, and this is where Google Lighthouse comes in.
There’s no point in improving your score for performance from 55 to 60 if the changes you make end up causing your accessibility and SEO to drop. If you’re only focused on PageSpeed Insights, this is a possibility.
Still, if you’re keeping an eye on Google Lighthouse, you can help ensure the changes you make have an overall positive impact on your website.
How to Use Google Lighthouse
Google Lighthouse gives you a fairly technical analysis of your website, but you don’t need to be tech-savvy to run it. In fact, it takes just one click of the keyboard and two clicks of the mouse.
There are two ways you can run Lighthouse: through developer tools and a Chrome add-on.
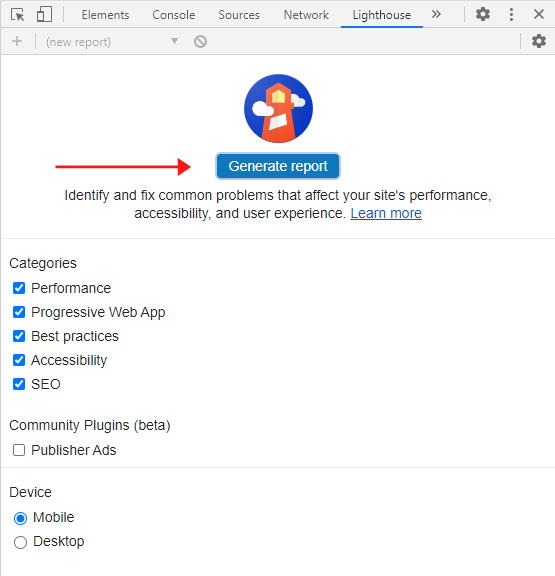
Google Lighthouse in Developer Tools
- Open your target web page in Google Chrome.
- Click F12 or Ctrl+Shift+J for Windows and Shift+Cmnd+I on Mac to open the Developer Tools Audit Panel.
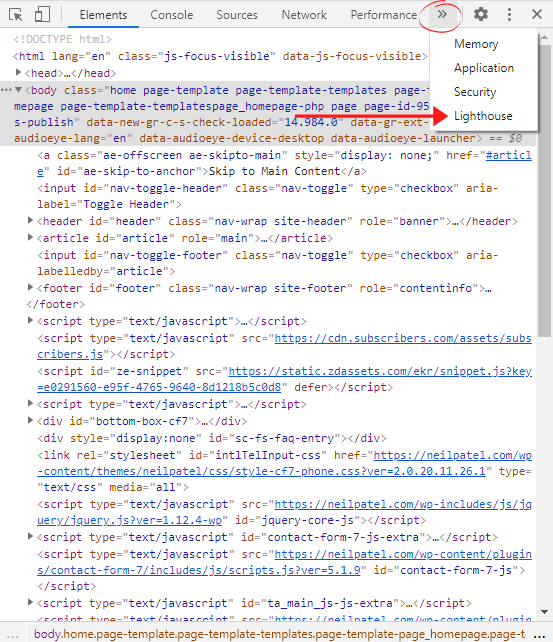
- From the tabs at the top, select the two arrows to expand the menu.
- Click on “Lighthouse” from the dropdown menu.
- Select whether you want to analyze mobile or desktop performance
- Click “Generate Report.”
Chrome Add-On for Google Lighthouse
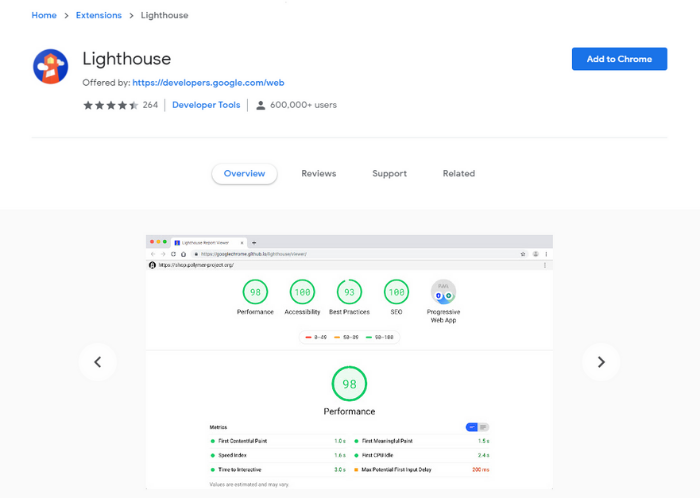
- Search for Lighthouse in the Chrome web store.
- Select “add to Chrome” and click “add extension.”
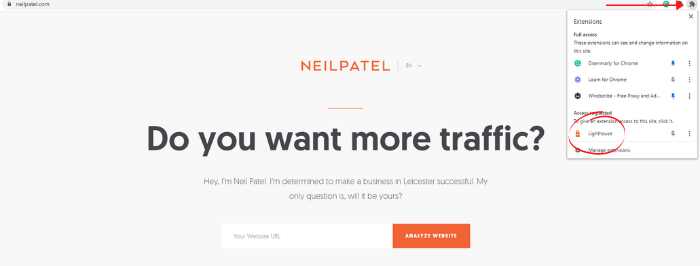
- Click the puzzle icon near the top-right corner of your browser.
- Select the Lighthouse icon.
- Click “Generate Report.”
- A new tab will open with your report.
It’s also worth remembering that if you’re using any supplemental SEO tools such as Ubersuggest, these will likely pull information from Lighthouse for you.
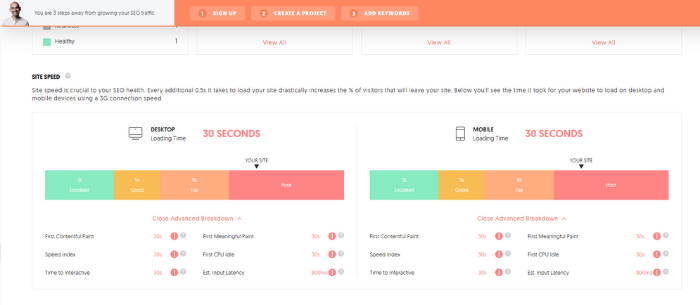
When you run a URL through Ubersuggest, you’ll find performance data on your dashboard with the same information you see on your Lighthouse reports.
This helps make it a one-stop place for all your SEO needs, combining information about your website performance with keyword and competitor analysis.
Conclusion
Lighthouse provides a sneak-peek into how Google judges your web pages. Not only is this vital to rank well in the search engines, but it gives you important data into how users experience your website, no matter how they land there.
Page experience is becoming an increasingly important factor for Google; it needs to become equally important for website owners.
Lighthouse provides the insights needed to make tangible improvements in the way your users experience your website — which can make a big difference in how successful your site is at converting on your goals.
With Lighthouse, Google offers free information to help improve your website, and it takes almost no time at all to generate a report. So, make the most of it!
Is Lighthouse your favorite Google tool? If not, which is?
The post What is Google Lighthouse? appeared first on Neil Patel.
from Blog – Neil Patel https://ift.tt/3aN3hyX
via IFTTT
No comments:
Post a Comment