To create a paid ad campaign effectively, you need a solid strategy for organizing your data and tracking your ad performance.
Excel spreadsheets can do just that.
While a spreadsheet might not seem like the most intuitive tool for managing your marketing efforts, there are many Excel tricks you can use to quickly streamline your data, track metrics, and improve conversions.
There’s no need to be an Excel expert to master these tricks. All you need is access to a version of Excel and a desire to learn.
Maybe you’re wondering if you should bother learning Excel if you already use other tools like CRM software or Google Analytics to manage your marketing campaigns.
Honestly, you probably should.
The humble Excel spreadsheet offers you a simple yet highly effective way to organize all your data from various project management tools in one place. Whether you want to use your spreadsheet for keyword research or you’re turning data into a bar chart, there’s an Excel trick to make your job easier.
Plus, you never know: You could end up at a company that still strictly uses Excel for these things!
With all this in mind, let’s look at using Excel to boost your paid ad or pay-per-click (PPC) campaigns.
Should I Use Excel or Google Sheets?
Excel and Google Sheets aren’t the same thing.
Google Sheets is a fantastic (and free) alternative to Excel. It’s not designed to handle the enormous data sets you might want to hold in Excel, such as keyword research, but it’s excellent for managing deadlines, analyzing customer relationship data, and filtering statistics to gain some key insights into your ad performance.
I’ll be using Excel to work through examples here, but you can, of course, use Google Sheets for many of these tasks if that’s what’s available to you. You can also check out Calc from OpenOffice since the functions on offer are very similar.
5 Excel Tricks to Use in Paid Ad Campaigns
When creating paid ad campaigns, you need to think about which keywords to use and bid on, how to boost your click-through rate, and how to increase your conversions once people land on your page. What’s more, you need the means to compare different ads within the same family to check for underperforming content.
Excel, thankfully, can help you tackle all of these issues and more, so here are my top five Excel tricks you can use to design, track, and analyze your paid ad campaigns.
1. Filter and Sort Key Data
As I’ve touched on, the goal of creating a PPC campaign is to get as many clicks and conversions as possible. How do you maximize your chances of success? You first need to choose the right keywords.
If you use keyword research tools like Ubersuggest, you probably see hundreds, if not thousands, of keyword suggestions. Excel can help you sort through this data to identify the keywords you should be using.
Depending on your campaign goals, you can filter the data based on factors including:
- SEO difficulty
- traffic
- relevance
- cost per click (CPC)
Say you’re creating a PPC campaign around video marketing. You input the keyword “video marketing” into Ubersuggest. When you click “View all keyword ideas,” you’ll see 342 suggested keywords and over 11,000 related keywords.
How do you translate this into Excel? First, download a copy of the keywords by clicking the “Export to CSV” button:
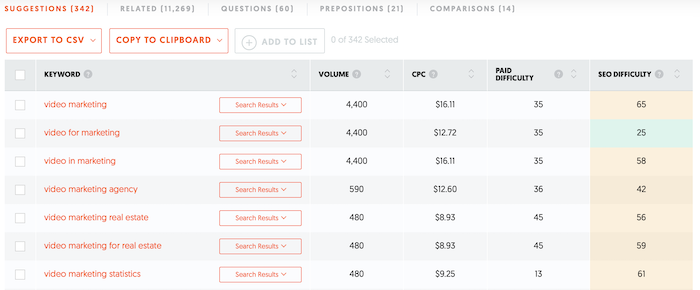
Now, filter the results to only see the keywords most relevant to you and your campaign. To do so, load up the spreadsheet, head to the “Data” tab, and click the “Filter” option:

For our example, let’s filter the keywords based on SEO difficulty. Go to the column header and click the arrow. From the drop-down menu, uncheck the boxes for the irrelevant keywords. They’ll disappear from your search results so you can focus on the important keywords:
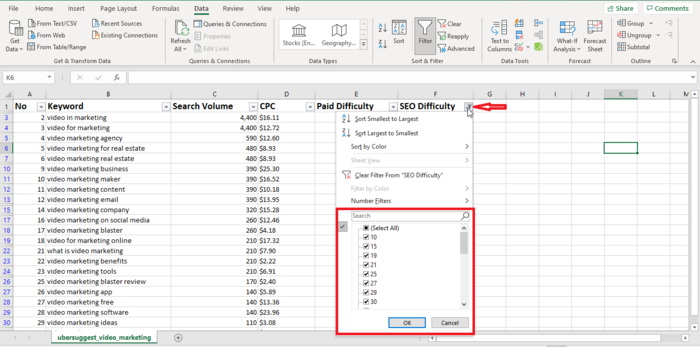
Once you’ve finished analyzing the data based on one filter, you can quickly switch to another using this Excel trick.
You can also filter out “negative” keywords from your search results. Say you don’t want your PPC ad to appear in search results for “real estate” because you’re not targeting this audience. Click on “Text filters” from the drop-down menu, then “Does not contain.” Input the words “real estate” into the box.
2. Use a PivotTable to Track and Compare Audience Demographics
The next Excel trick I’ll show you is how to create a PivotTable.
What is a PivotTable? Think of it as a kind of interactive report. It allows you to analyze massive data sets and extract critical data to inform your decision-making process. Here’s what a PivotTable might look like:
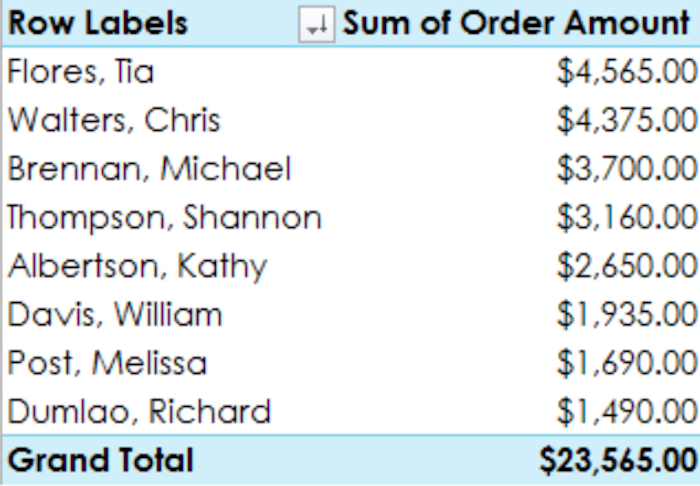
From a marketing perspective, PivotTables are invaluable. They can show you, at a glance, who is clicking on your ad and where they’re based. What’s more, if you’re running multiple ads, you can identify if certain demographics are clicking on one ad more than the others, and so on.
In other words, if you’re a marketer trying to track your campaign’s success, a PivotTable could be your new best friend.
To use a PivotTable effectively, first identify your data source. You might use data from Google Analytics or another analytics tool.
Next, import this data into an Excel spreadsheet. The easiest way to do this is by importing a CSV into Excel. To import a CSV into a new Excel workbook, simply click the “Data” tab, then click “Get External Data” and select “Text” from the menu options:
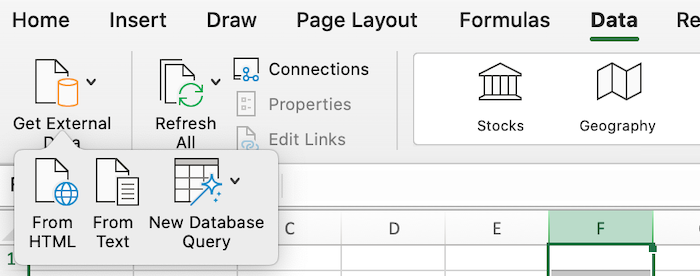
Once you’ve checked the data moved over correctly, create your PivotTable. Include columns for demographic data such as location, age, and gender, and columns tracking metrics such as conversions and impressions.
Highlight the cells containing the data you’re interested in, then go to the “Insert” tab and click “PivotTable.” Confirm the fields you want to include to generate your table.
Next, decide what data you want to include in your PivotTable. For instance, if you’re tracking audience demographics, have columns for data such as location, age, and gender.
You also need columns for metrics like clicks, impressions, and conversions because you’re trying to track performance.
Finally, analyze the results and make whatever changes you need to increase your conversions and improve your PPC campaign success.
3. Use VLOOKUP to Track Metrics
Do you want to combine two sets of data from different spreadsheets or tracking tools into a single sheet? Then you need to check out the VLOOKUP function.
Essentially, VLOOKUP allows you to quickly combine a vertical column of data from one spreadsheet into another. Be aware: Both data sources must have at least one column in common, or this method won’t work.
Say you’re looking for new keywords for your PPC campaign. You don’t want to duplicate keywords, so you’re looking to see if any of the new keywords you found are already on your existing keyword spreadsheet or PivotTable.
You can use the VLOOKUP Excel trick to identify any genuinely new keywords and import them into your spreadsheet.
First, identify the new column in your existing spreadsheet that you want to fill with fresh keywords. Then, select “VLOOKUP” from the “Formulas” tab.
Next, complete the VLOOKUP formula. You’ll need four things:
- Lookup Value: This is the value that both data sets have in common, such as a keyword.
- Table Array: Table array is the range of columns you’re pulling from.
- Column Number: The column number is what column number you’re pulling data from. For example, if you’re pulling data from the second column in your table array, the column number is “2.”
- Range: Finally, it’s best if you keep the range “FALSE” to only pull exact matches.
Once you complete the formula, the data sets merge.
VLOOKUP is pretty technical, so check out the Office support page for more help creating your formulas.
4. Use Graphs to Add Visual Elements to Your Ads
Visual marketing works. Visuals can increase audience engagement by up to 40 percent, and 40 percent of marketers believe that infographics were their most successful visual content.
When you’re creating PPC ads, it’s worth adding original graphics or data visualization tools, like bar charts or graphs, to potentially increase your click-through rates and conversions. Luckily, Excel can help you do this.
If you’ve already got a PivotTable, it only takes a few clicks to turn it into a chart. Simply click the “Analyze” tab, select “PivotChart,” and decide which chart type you want to use. That’s it!
Don’t have a PivotTable? Fear not.
First, select the data you want to include in your chart, click “Insert,” then hit the “Recommended Charts” button:
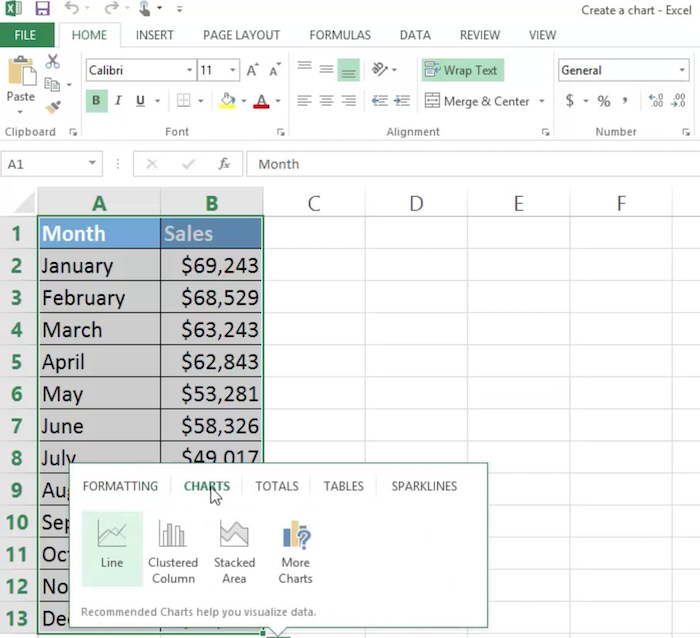
Pick the design you like most and generate the chart:
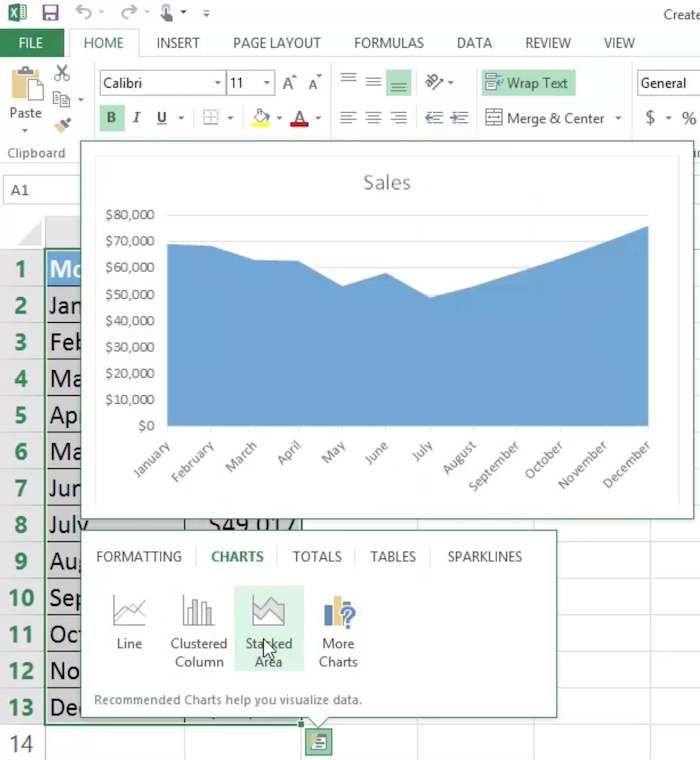
The Microsoft support page has more hints and tips for customizing your chart.
5. Save Time With Excel Macros
When you create paid ads, you often perform the same steps each time. Excel lets you automate repetitive tasks to save you time.
How do you automate these tasks? Through this neat little Excel feature called a macro.
Macros are essentially automated or recorded sequences. You “record” a set of actions you want Excel to automate, like keystrokes. When you need this action performed again, you simply run the macro, and Excel handles the rest for you.
Well, there’s no limit to what you can use them for, but here are some suggestions for paid ad campaign steps you might automate.
- completing keyword research
- generating new campaigns
- converting data into PivotTables
- building new templates
Setting up a macro should be a short process, though you can always check out the Microsoft help page if you need more guidance.
First, ensure you can see the “Developer” tab in Excel. From here, hit “Visual Basic” and then click the “Record” button. If you can’t see the Developer tab, just click the “View” tab and hit “Record Macro” there instead:

Choose a name for your macro and then start recording. Once you click “OK,” Excel records every action you take on the spreadsheet until you hit “Stop Recording.” Now you’ve got a macro set up to use whenever you need it.
Before you run a real and complicated macro, try setting up your own simple test macro to get a feel for how they work.
Conclusion
If you’re a marketer, these Excel tricks can help you create, track, and manage your paid ad campaigns more effectively than before. There’s no need to be an Excel expert, either. All you need to know are a few simple commands, and you could be up and running pretty quickly.
From keyword research to customer relationship management, Excel could be the tool you’re looking for. Once you’ve tried these Excel tricks a few times, you’ll probably wonder how you managed to run your PPC campaigns without them!
If you need any more help with Excel, be sure to check out Microsoft’s Excel Community support page.
Have you used any of these Excel tricks for your paid ad campaigns?
from Blog – Neil Patel https://ift.tt/3vbINqG
via IFTTT
No comments:
Post a Comment