Disclosure: This content is reader-supported, which means if you click on some of our links that we may earn a commission.
The thing about data is it helps you make better business decisions. But without analyzing it, you won’t really understand what needs to be done.
Everyone has questions when it comes to choosing data analysis software.
Why are there so many data analytics tools? Which one is worth your money? Can they actually help you achieve your business goals?
You have to arrange your data, explain it, present it properly, and then derive a conclusion from it.
If it sounds complicated, that’s because it is.
Luckily, data analysis software can seriously simplify data analysis—provided you choose the right one.
To make sure you make the right decision, we’ve compiled a list of the best data analysis tools available that can help your business now as well as in the future.
Let’s begin!
The Top 5 Options for Best Data Analysis Tools:
- Zoho Analytics – The Best for Designing Drag-and-Drop Reports and Dashboards
- Microsoft Power Business Intelligence (BI) – The Best for Building Automated ML Models
- Tableau – The Best for Data Visualization
- Sprinkle – The Best for Teams With Less Technical Knowledge
- Apache Spark – The Best for Scalability
How to Choose the Best Data Analysis Software for You
Data analysis software isn’t a cheap investment, so use caution when making a selection. If you end up with the wrong tool, you won’t get the actionable insights you need, which defeats the whole purpose of buying one in the first place.
The obvious criteria are to select a tool that’s easy to use and has intuitive software. This will simplify the whole process of dealing with heaps of complex data.
But here are a few other factors you should look out for when evaluating a prospective software.
User Skillset
Your team is the very pulse of your business, which is why their skillset is the most crucial factor when it comes to choosing a software tool.
Figure out the technical knowledge of your team. Do you have a team of engineers and data scientists who know programming languages like Python, SQL, and R? Or is your team less technical?
If your team members speak geek, you can opt for the more advanced data analysis tools. But if they don’t, a no-code data analysis tool would be more appropriate to get the job done without having to hire experts.
Scalability
It’s obvious to want a software tool that meets your requirements. But at the same time, it should also be able to follow your company‘s growth over time.
If you plan on expanding your business, the data analysis software should have the capacity to accommodate this change. Additionally, if you want project-specific KPIs, the software tool should be able to deliver that, too.
This is a very vital factor because replacing a data analysis software can be incredibly difficult. If you choose the wrong software, you might have to stick with it in the long run—or break your bank and spend a lot of time trying to replace it. Yikes.
Tool Implementation Timeframe
Think about how long it’ll take to implement the software and whether it meets your requirements.
If you need a solution that’s up and running within four weeks, it would be unwise to buy a software tool with a four-month implementation timeframe. To get a better idea about the time-to-implement, speak to the service provider or the software developer.
We’d also recommend chatting with previous and current users when possible to get a more realistic idea about the implementation timeframe.
Reporting Tool Availability
It’s best to look for data analysis software fitted with efficient reporting tools to make sense of all the data and gain deeper insights.
These tools should help you understand your business in more detail, including important metrics, inventory, and sales numbers. You should be able to identify problem areas, along with ways to improve them.
System Integration
Find out whether the prospective data analysis tool supports the file formats you already use and if it can work seamlessly with the other business tools used in your day-to-day operations.
Remember, clashing software tools cause confusion and slow down productivity. It’s also possible that your team will just abandon a tool if they find it too hard to use.
The Different Types of Data Analysis Software
Contrary to popular belief, there are several types of data analysis software. We’ll discuss each kind in more detail below.
Predictive & Prescriptive Analysis Software
The whole concept of business revolves around predictions and assumptions. It’s precisely why companies need to continuously hone their predictive engines and use effective tools to predict the future as accurately as they can.
This is also where predictive and prescriptive analysis comes in.
Predictive analysis software can help you picture potential scenarios. On the other hand, prescriptive analysis software is like that doctor who prescribes what decisions and actions you should take given a specific situation and the likely scenarios for every decision.
Text Analysis Software
Text analysis tools allow your business to analyze text from social media accounts and documents. You can use the content to gain context and insights and also interpret your target audience’s sentiments.
Typically, such tools are used in combination with social media listening products. But it isn’t always necessary as you can find standalone products for general use, too.
Diagnostic Analysis Software
Diagnostic analysis tools and processes help you diagnose your day-to-day operations, keeping everything in record, and analyzing your performance.
This type of analysis is mainly focused on the causes and effects of potential processes. If you use diagnostic analysis tools correctly, you’ll be able to determine possible policies and future courses of action to optimize your processes more effectively.
Descriptive & Inferential Analysis
Descriptive analysis tools describe and quantify your collected data, which, in turn, allows you to find outliers and variance, among other things. You can properly summarize your data through these tools.
On the other hand, inferential analysis software takes in your sample information for making useful and reliable generalizations. We’ve clubbed both types of analysis as most software comes with both sets of tools.
So, that was everything you need to know about data analysis software. Now, let’s discuss our top picks.
#1 – Zoho Analytics – The Best for Designing Drag-and-Drop Reports and Dashboards
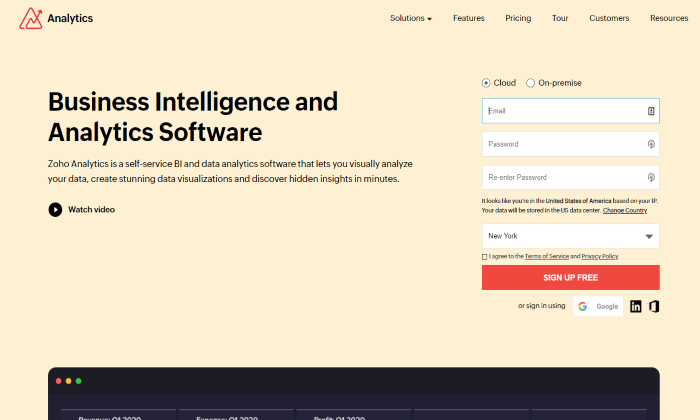
Zoho Analytics is a powerful data analysis software that converts data into intuitive visualization, supplying you with actionable insights to facilitate better decision-making.

It can identify market trends, uncover insights, determine outliers, and monitor crucial business metrics. The software then uses all this information to create powerful drop-and drag reports. What’s more, it can streamline syncing and importing data to allow you to merge, format, clean, and split all sorts of data before finally calculating feeds.
It has an innovative drag-and-drop functionality through which users can create dashboards without any professional help. The platform’s dashboards give you a comprehensive and quick glance at key business metrics like rich text format and reports.
A unique feature of Zoho Analytics is its AI-powered assistant that can answer all your questions in the form of meaningful reports.
Over 500,000 businesses use Zoho Analytics, including PETA, Suzuki, IKEA, and HP.
Pricing
Zoho Analytics offers four online service plans:
- Basic: $22 per month
- Standard: $45 per month
- Premium: $112 per month
- Enterprise: $445 per month
Keep in mind that the on-premise services have a different pricing structure. You can also try out a 15-day free trial if you want to see if it is right for you.
#2 – Microsoft Power Business Intelligence (BI) – the Best for Building Automated ML Models
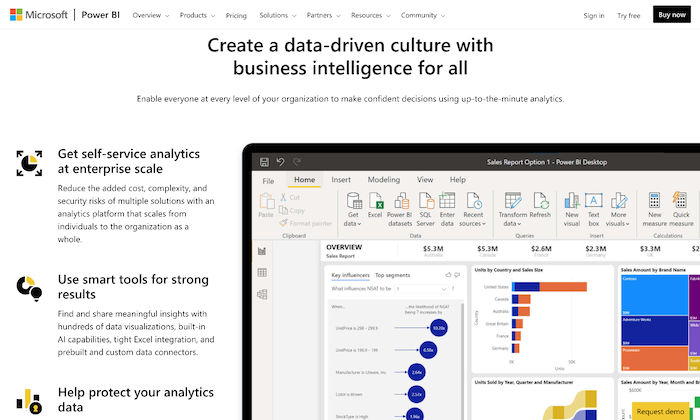
Powered by the bigshot Microsoft, Power BI is as powerful as a business analytics tool can get.
It’s one of the leading business intelligence platforms that supports plenty of data sources to make data analysis more convenient. You can use the tool to create and share reports, dashboards, and visualizations, building automated machine learning models.
Whether it’s real-time analytics data streaming or offering insights at scale, this tool can do it all. Use it to configure your data to create easily digestible reports developed according to your predetermined KPIs and metrics.
Power BI can integrate with Azure Machine Learning—plus, its ML and AI features are driven by Azure functions built into the Azure Cloud. Its image analytics feature can also be useful to make better business decisions.
Companies like Nestlé, Worldsmart, Ecolab, and GE Healthcare, trust Microsoft Power BI’s robust analytics and insightful reporting to streamline their decision-making process.
Pricing
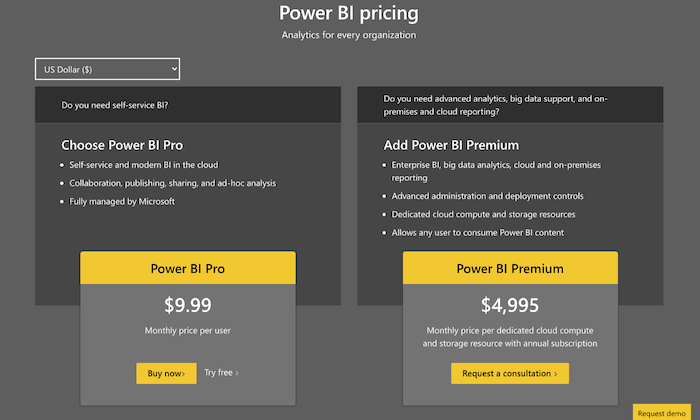
Microsoft Power BI offers two pricing plans:
- Power BI Pro: $9.99 per month per user
- Power BI Premium: $4995 per month for dedicated cloud computing and storage resources
A free trial to test the software features is also available.
#3 – Tableau – The Best for Data Visualization
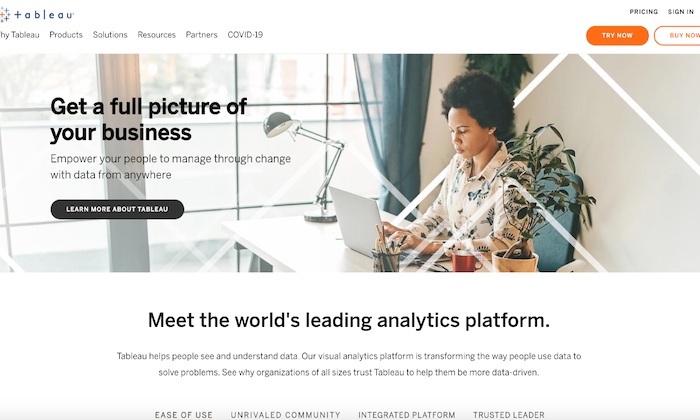
It’s hard to beat Tableau when it comes to data visualization and analytics.
Since the software includes several modern and advanced features, the learning curve is slightly steeper. But once you get the hang of the dashboard, things will get much easier.
This tool is very intuitive and comes with mature and advanced features. Tableau can handle tons of data with ease thanks to its smart features that work at lightning-fast speed and offers custom visualization reports for exploration and analysis.
You can create charts, maps, graphs, dashboards, applications, and reports and then share them across mobile and desktop platforms or within a browser. The reports can also be embedded in an application.
Tableau has found takers in Audi, LinkedIn, Barclays, and Skype. Really, this data analysis software is suitable for organizations of all sizes as it offers all kinds of solutions—each fitted with specific features to solve problems.
Pricing
Tableau offers three plans:
- Duo: $140
- Team: $278
- Small Business: $1778
A free trial is available too if you want to test out its features.
#4 – Sprinkle – The Best for Teams With Less Technical Knowledge
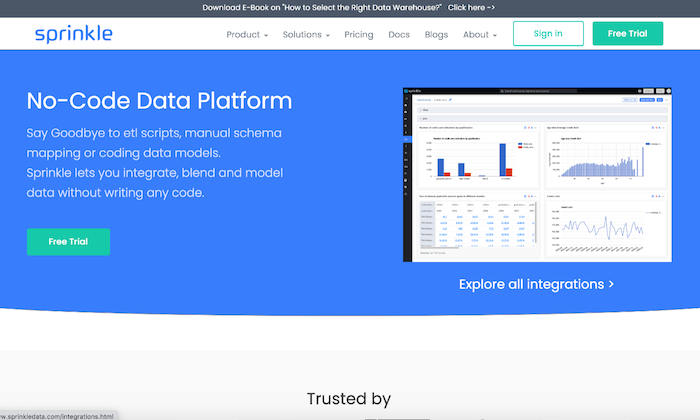
Sprinkle is a no-code analytics platform, making it perfect for teams with limited technical knowledge. They can use the tool to integrate, blend, and model data without writing any code.
It automates processes right from collecting data from the different data sources, moving it to a preferred data warehouse to build reliable reports, and finally presenting it in an easily digestible format.
The tool supports real-time data pipeline solutions, allowing you to make decisions faster, which helps accelerate organizational growth. Even the security level is top-notch, with users being promised 100% data security at all times.
Sprinkle offers an on-premise as well as a SaaS deployment option. It also has an optional integrated Advanced Reporting and BI module that can be used for developing interactive dashboards with drag-and-drop reports, featuring drill-downs.
This data analysis software is trusted by companies like Swiggy, Yulu, Bright, and LeadSquared.
Pricing
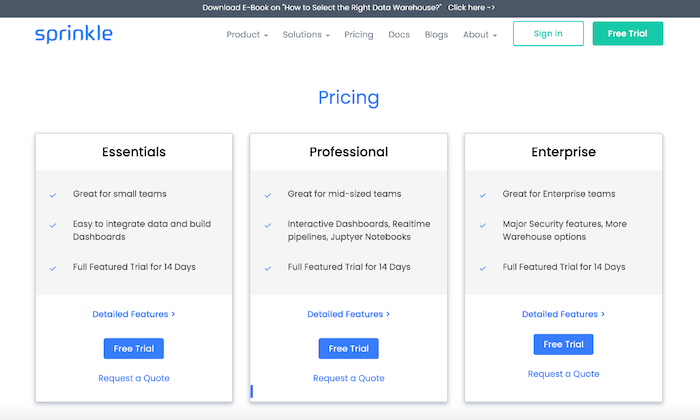
Sprinkle offers three subscription plans: Essentials, Professional, and Enterprise. As pricing information is unavailable on its website, you’ll have to contact the sales professional to request a quote.
A 14-day fully-featured trial is available for all three plans.
#5 – Apache Spark – The Best for Scalability
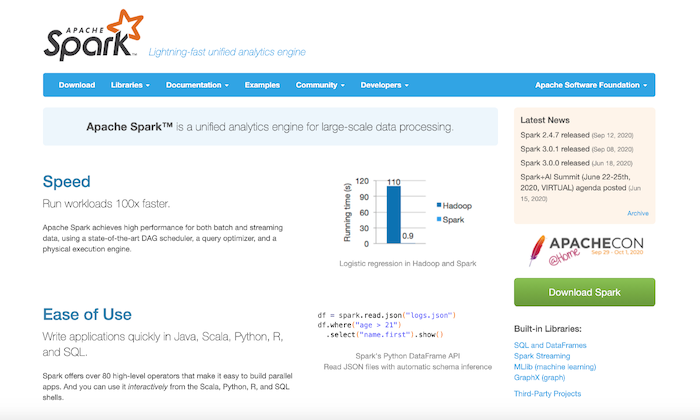
Apache Spark should be at the top of the list of people who want big data analysis on a budget. Top companies like Netflix, Visa, Uber, Slack, and Yahoo use Spark, and it’s easy to see why.
It offers excellent speed and scalability, making it one of the fastest-growing large scale data processing engines. The tool is compatible with almost everything, which also means it’s very versatile.
You can use the software for cleansing and transforming data and developing evaluation and scoring models. Deciding data science pipelines for production purposes is also possible.
Data analysts prefer Apache Spark as it’s a free and a user-friendly open-source tool.
Plus, it executes applications in Hadoop clusters ten times faster on disk and one hundred times faster in memory. It works well for streaming data as the platform uses powerful and high-performance machine learning algorithms, such as GraphX, SparkStreaming, SparkSQL, and MLlib.
You can use these algorithms to implement and execute computational jobs and tasks at a much faster rate, which, in turn, will help you process and analyze data more precisely and quickly.
Apache Spark also cross-checks the execution plan to identify errors. Hence, it eliminates any bad code from taking over the process.
Pricing
Apache Spark is completely free. And there is no enterprise pricing plan that you need to worry about in the future.
Takeaway Thoughts
There’s no contesting the importance of data, but you need advanced tools like data analysis software to utilize it to its true potential. It’s the best way to make sense of what you collect.
We made a point to include software options that assure reliability and efficiency. So you can select anyone based on your needs. Whether you’re starting as a data analyst or are an experienced professional dealing with big data, these tools can really help simplify and quicken the whole data managing process.
The post Best Data Analysis Software appeared first on Neil Patel.
from Blog – Neil Patel https://ift.tt/3piwBBI
via IFTTT
No comments:
Post a Comment